Graphing Knocksum with Evoscan

Reading the Tactrix SD card CSV logs in excel is doable, but sometimes you need a quick overview of how the run went, or perhaps you might want to send screenshot of the log’s knocksum to another enthusiast.
The best way to do this that I’ve found is to graph knocksum with Evoscan.
This is how you do it:
1. Buy Evoscan from here. They’re a small company, so go on do the right thing and pay the small fee
2. Download & Install it
3. Load it. You should see the following screen. Click the Graph / Logs button:
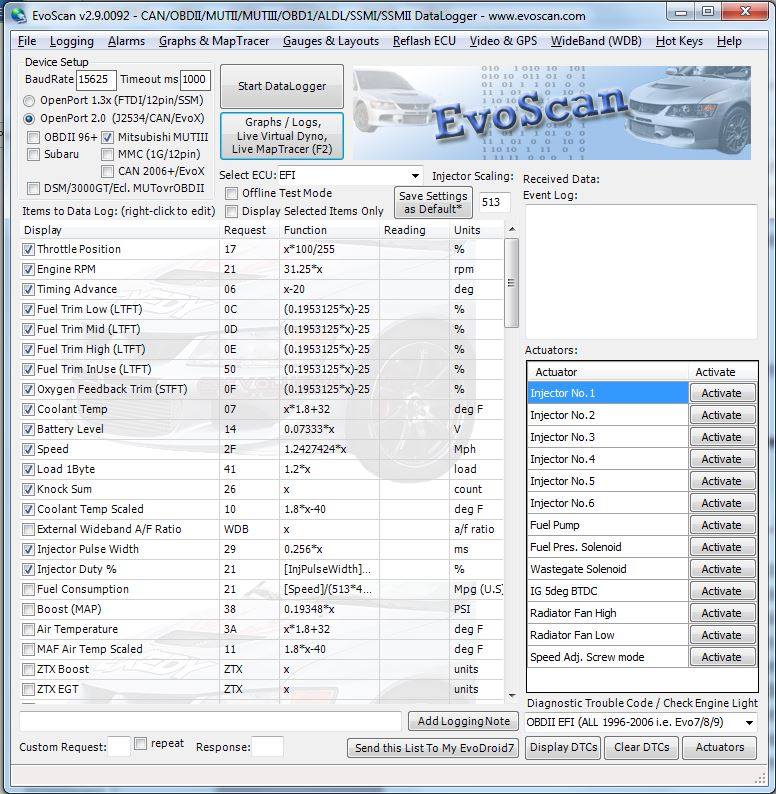
4. This will load the graphing screen (below). Note you can also do live logging from this screen. Anyway, lets set it up to read your Tactrix CSV log.
- Set Data Values to Maximum
- Set Load to ECULoad. If you have logged 2-byte load (if you don’t know what this is, then you haven’t) select ‘Load MUT 2 Byte’, or Auto.
- Use Load #1 Log button to load your CSV
- Select ‘Knock Sum’
- Your Max Knocksum graph should now be displayed
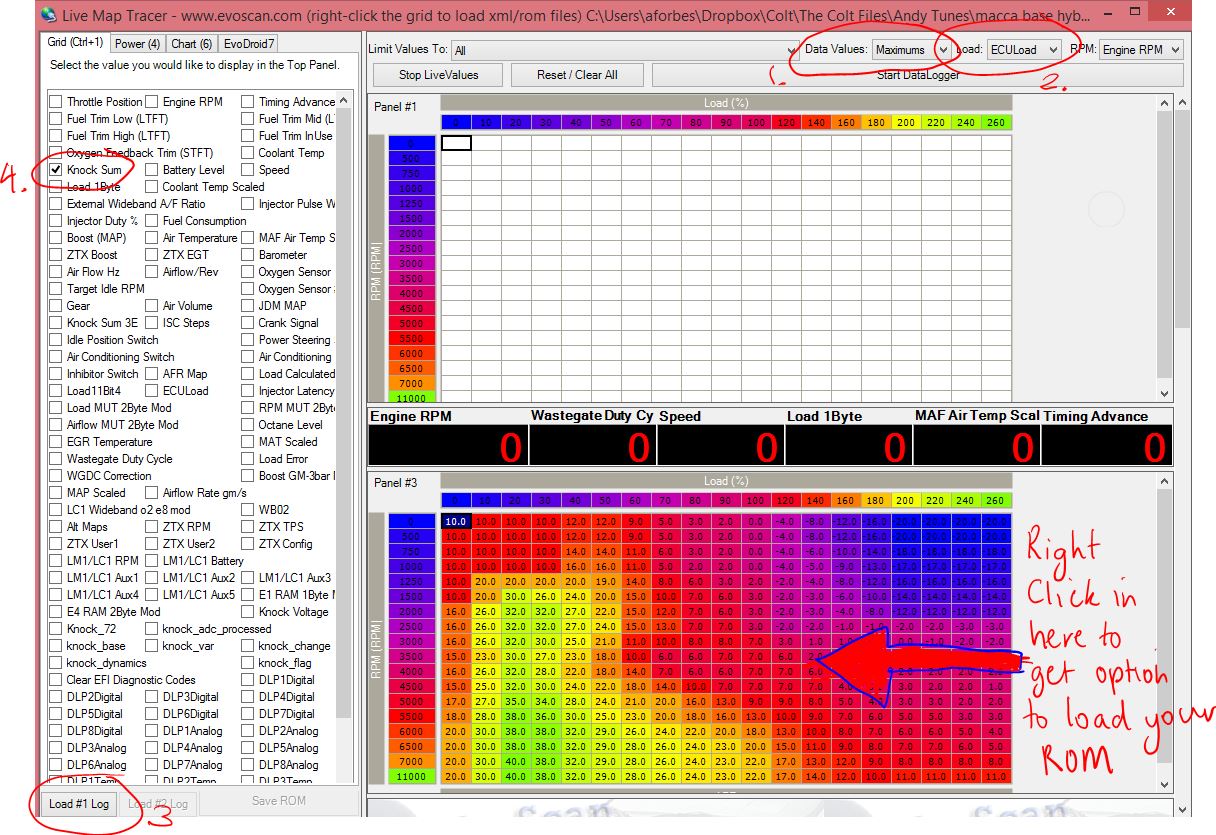
5. By default evoscan will be displaying an ignition map from an Evo and axis’ from an Evo. You may find that this squashes up your knocksum data and you’re not getting quite the detail you were after. To fix this, right click on the ignition map area, and select load ROM. Navigate to your car’s current ROM and load it. The axis will be redrawn using your ROM’s axis, and the correct ignition information will be displayed. This is particularly important if you are adjusting the ROM based on the Evoscan graph.
Ok so now you have nice graph that looks something like the images below. Now what? What’s good? Whats bad? This is as subject of another (long) post. But to help, I’ll describe what I see in two example knocksum graphs.
Graphing Knocksum with Evoscan example 1:
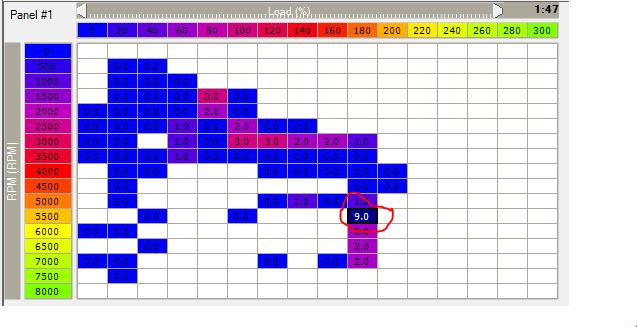
Anything above 4.0 and >140 load I generally consider concerning. Where that 9.0 is, I would check out how many other knocksums were registered at this point in the graph (either by hovering over the cell, or by loading in Excel). If it is clear that this is a troublesome area, and most are 9.0’s then I’d look at the main ignition map and consider taking one or two points off the ignition at that point. Note though, that the ignition at any point rarely fits exactly in the axis points, its usually slightly between two, or four other cells.. So consider if the ignition settings in the cells around areas of knocksum had any effect on the ignition used by the engine when it was knocking. I tune my Ralliart Colt for zero knocksum at 140 load and above.
The 3’s and 2’s at 3000rpms, aren’t significant and could just be caused by bad driving. I’d watch here on other logs and if there was a trend, i’d consider a small ignition change, perhaps in the two cells that have 3’s, then flash, and log it some more to see its impact.
Remember if you tune down your ignition your car will go slower, so adjust carefully and over time. This will help ensure that you’re not reducing your performance unnecessarily.
Graphing Knocksum with Evoscan example 2:
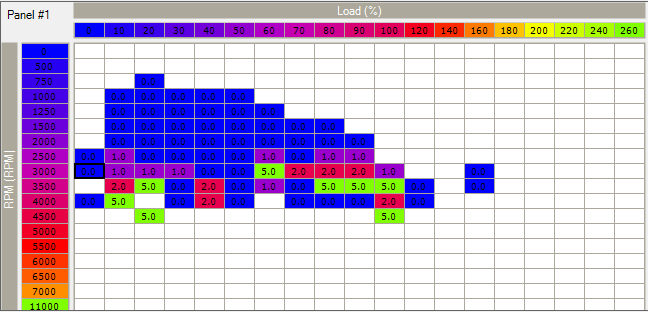
This log doesn’t show too much. The car wasn’t boosting high at all, but there are quite a few 5’s. If the entries at these points are consistently showing 5’s I’d look to make a small ignition change in this area (-1) and see if it improves knocksum in future logs.
Anyway please see this as just a soft intro intro the concept of knocksum tuning. Don’t apply it without more reading (find one of the Merlin’s Guides for Evos). I’ll write much more on ignition tuning in a future post.
Comments, questions on Graphing Knocksum with Evoscan or on ignition adjustments? Hit me up below or find me on Rcolt.com, or the Rcolt.com Facebook Group.

Leave a comment